Summary
The Summary page provides a high-level overview of sensor system health and performance across the platform.
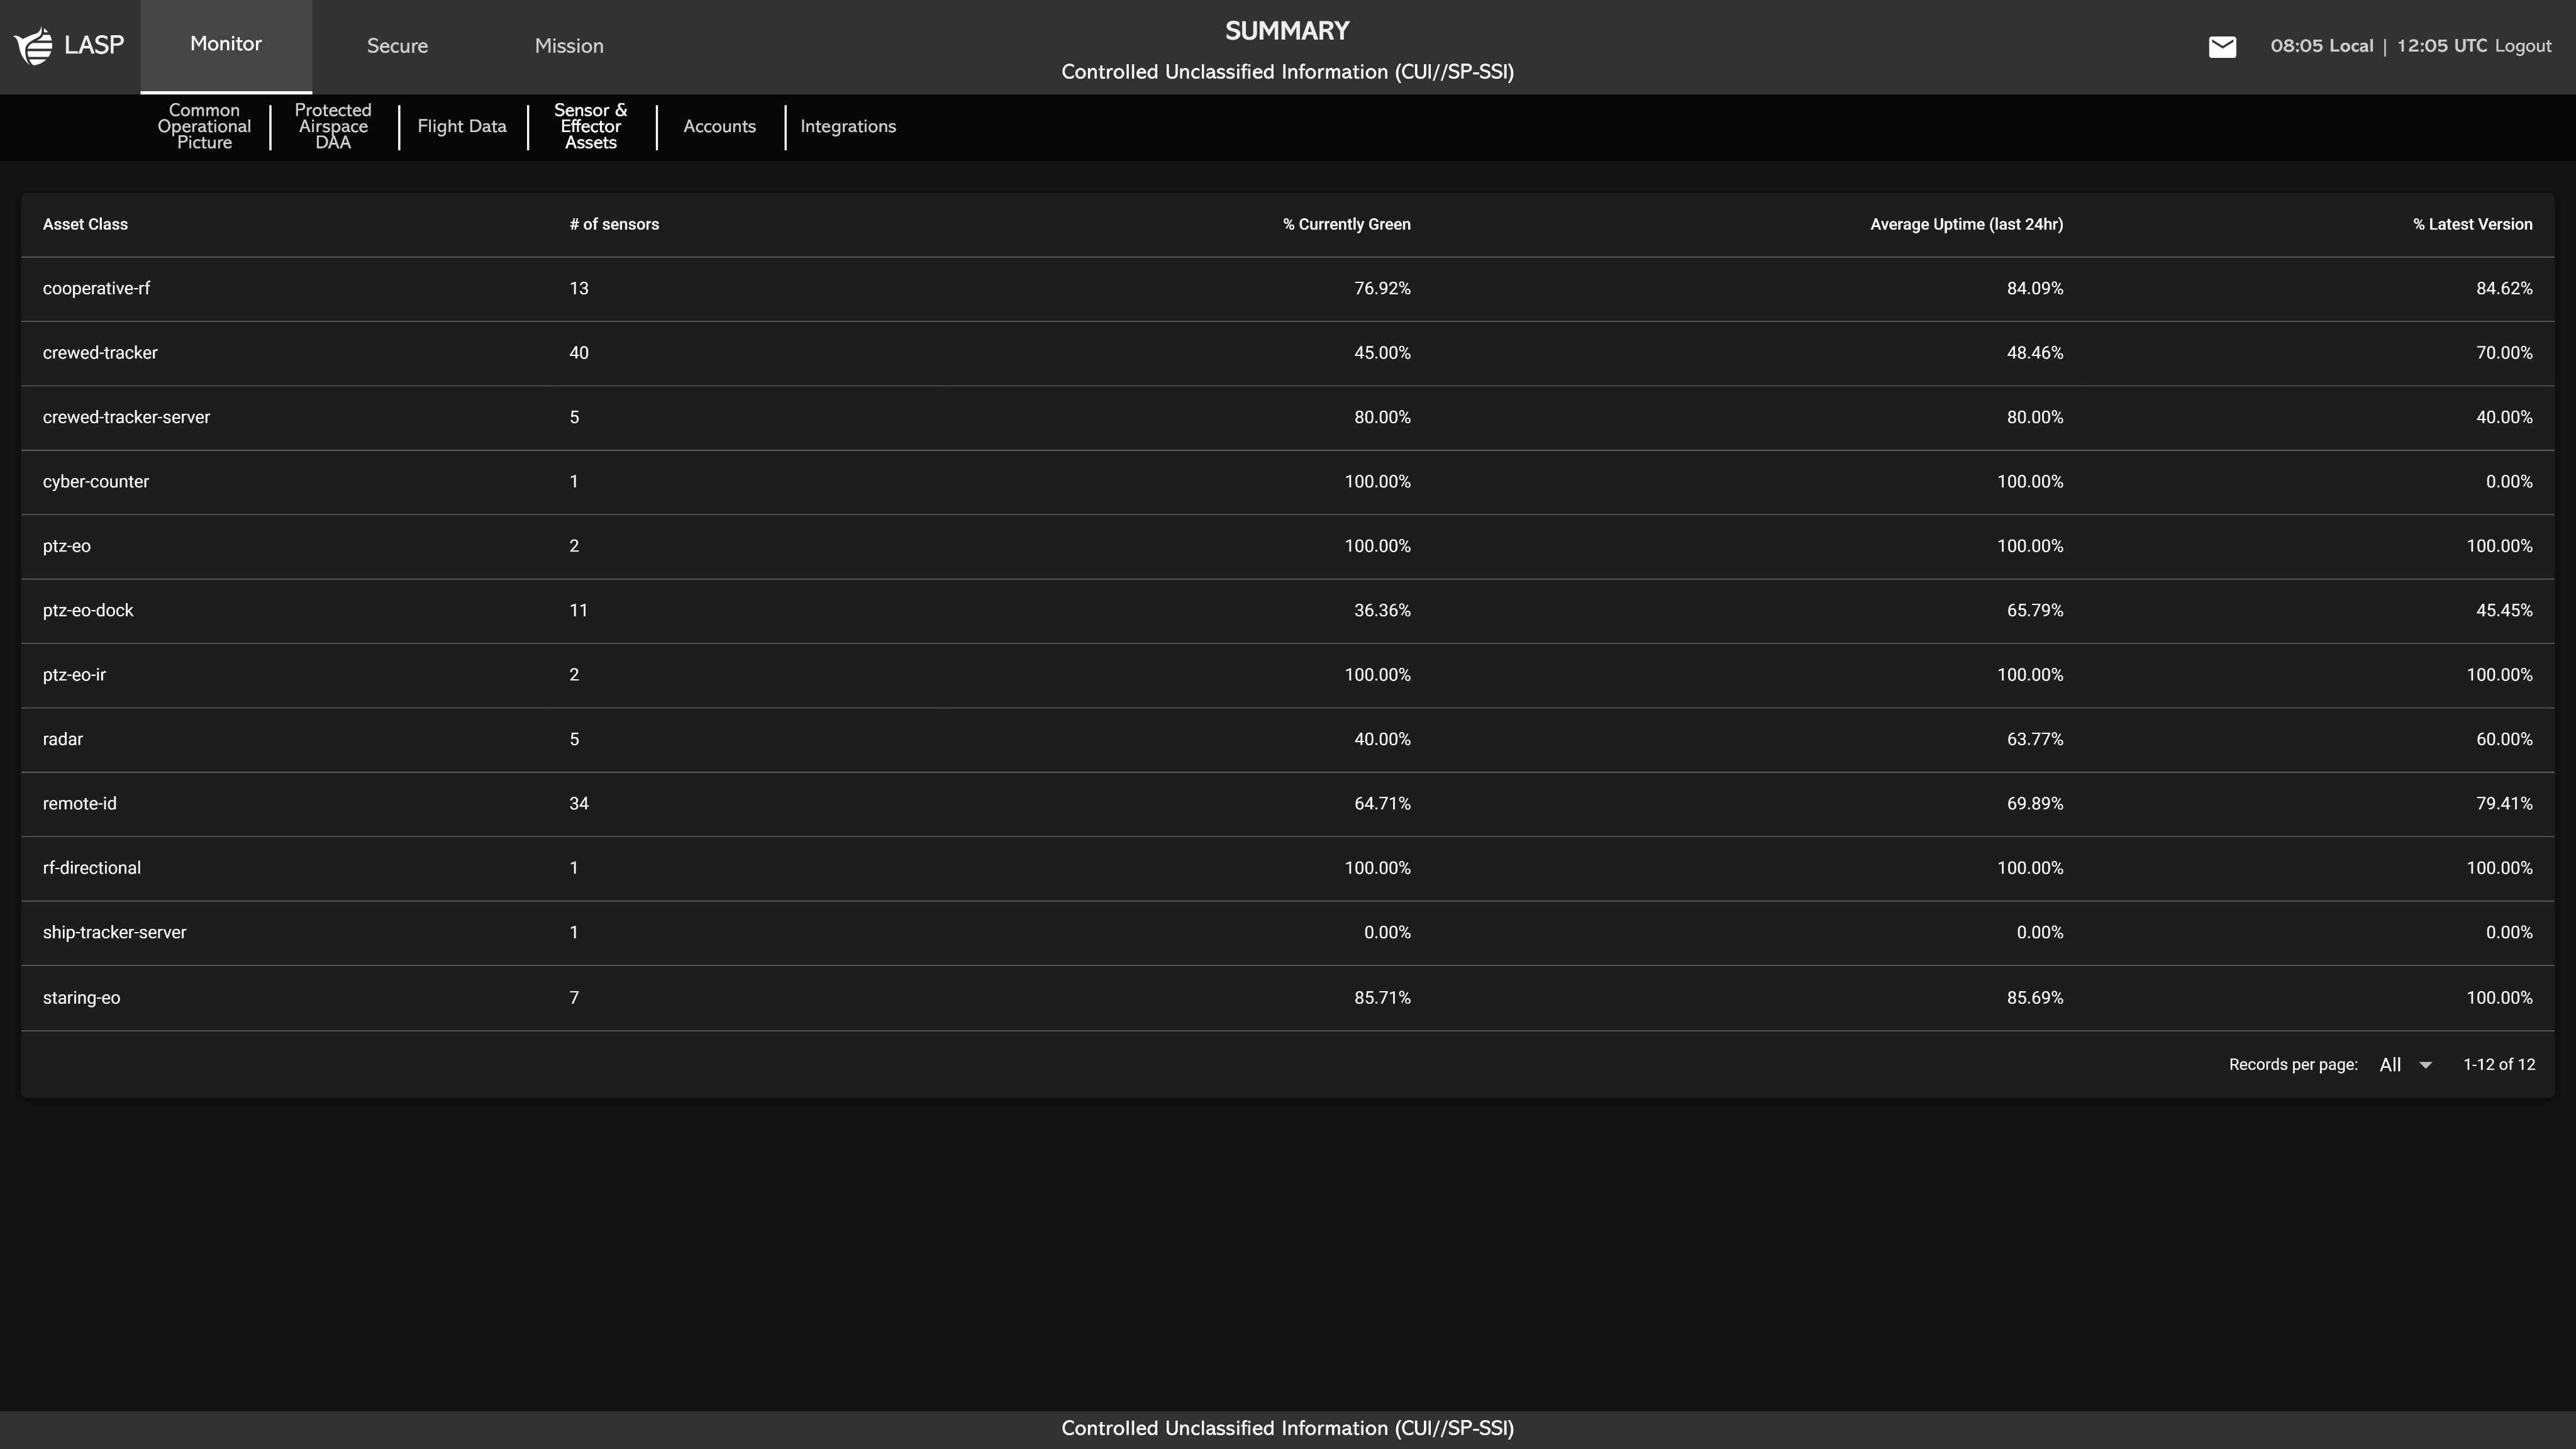
It includes the following key metrics:
- Sensor Count by Asset Class – Displays the total number of sensors grouped by their designated class (e.g., radar, remote-ID, cooperative-RF).
- Operational Status – Shows the percentage of sensors that are ‘green’, indicating they are currently active and functioning properly.
- Average Uptime – Calculates the average uptime across all sensors over a defined period (typically 24 hours).
- Version Compliance – Displays the percentage of sensors running the latest software version, helping track update rollouts and configuration consistency. This page is useful for quick operational assessments, identifying system-wide issues, and supporting maintenance or update planning.